Hello World Of Ml
Linear Regression
-
Regression is used to determine which variables have impact on a topic of interest
-
Linearity is mathematical representation of relationship between variables as a line
-
Regression allows us to determine which factors matter most, which factors can be ignored, and how these factors influence each other.
-
Core idea is to obtain BEST FIT Line
-
Best fit line has the total prediction error is as small as possible
-
Error is the distance between data point to the Regression line

Source:www.scribbr.com
-
Simple LR- One dependent variable, one independent variable
-
Multiple LR- One dependent variable, multiple independent variables
Source:www.sthda.com
-
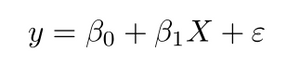
y is the predicted value for any given value of the independent variable (x)
-
B0 is the intercept, the predicted value of y when the x is 0
-
B1 is the regression coefficient – how much we expect y to change as x increases
-
x is the independent variable
-
e is the error of the estimate, or how much variation there is in our estimate of the regression coefficient
-
Goal is to find best fit line by searching for the regression coefficient (B1) that minimizes the total error (e) of the model
LR Metric-MSE(Mean Squared Error) and it is calculated by
-
measuring the distance of the observed y-values from the predicted y-values at each value of x
-
squaring each of these distances
-
calculating the mean of each of the squared distances
Real world applications of LR
-
Effect of different training regimens have on player performance
-
effect of fertilizer and water on crop yields